Statistical analysis is the backbone of data-driven decision-making, and one of the most fundamental tools at our disposal is the T-test. It's a statistical test used to compare the mean values of two groups and determine if they are different from each other in a statistically significant way. Today, we'll navigate through performing a simple T-test using three powerful tools: SAS, R, and Python, on a sample dataset.
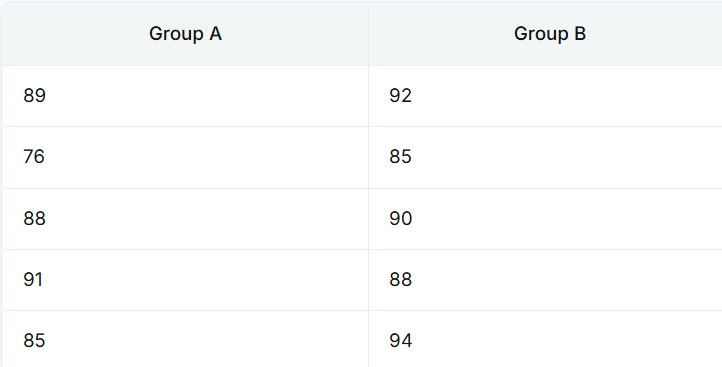
Let’s consider a simple dataset that explores the exam scores of two groups of students, Group A and Group B, who were taught with different teaching methods. Our aim is to determine if there’s a significant difference in their exam scores. Here is our sample data:

Note: For simplicity, we'll work with this small dataset directly coded into our scripts below, though ideally, data would be loaded from a file for more extensive datasets.
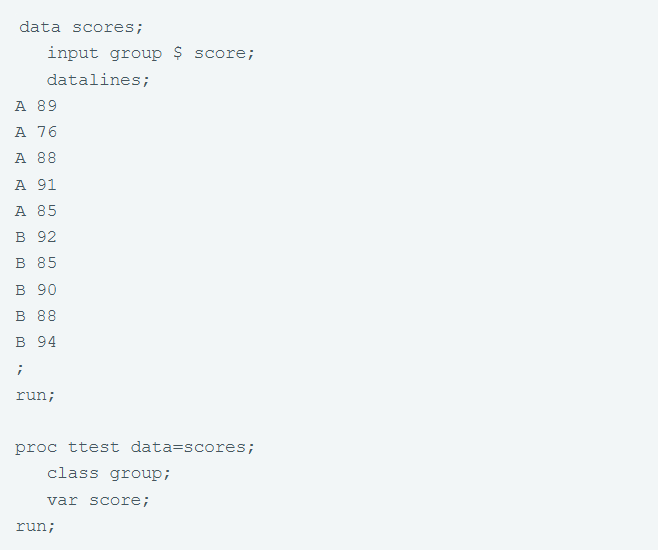
SAS is a robust statistical software suite widely used in academia and industry. Here's how you can perform the T-test using SAS:

In this SAS code snippet, we create a data set named 'scores' with the exam scores. The PROC TTTEST procedure is then used, where we define 'group' as our classification variable and 'score' as the variable we're analyzing.
R is an open-source programming language and environment specifically designed for statistical computing and graphics. Here’s how to perform the same T-test in R:

In this R script, we define two vectors, groupA and groupB, containing the exam scores. We then call the t.test() function with these two groups as arguments. R makes it incredibly easy to perform a T-test with minimal code.
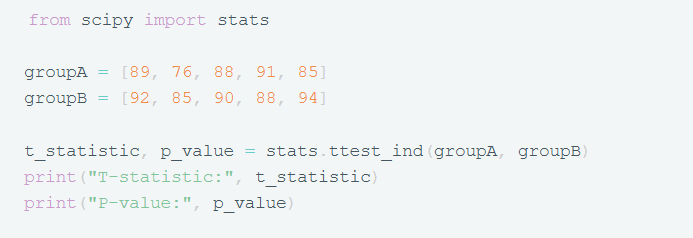
Python is a widely used high-level programming language, known for its readability and versatility. For statistical analysis, the scipy library is typically used. Here’s how the T-test is performed in Python:

In this Python code, we first import the stats module from scipy. We then define two lists, groupA and groupB, with our exam scores. The stats.ttest_ind() function is used to perform the T-test, returning the T-statistic and the P-value, which we print out.
Understanding how to perform a simple T-test across different statistical software platforms is crucial for data analysis across various fields. Each platform, SAS, R, and Python, offers a unique approach to performing the T-test, with varying degrees of verbosity and flexibility.
• SAS is highly reliable and offers in-depth options for complex data analysis, making it a favorite in industries with vast data audits like pharmaceuticals.
• R provides a statistician-friendly environment with extensive packages for various statistical tests, ideal for academia and research.
• Python, while not originally designed for statistical analysis, has grown immensely through libraries like scipy, offering a good balance between statistical rigor and general programming capabilities.
By mastering these tools, analysts can ensure their work remains rigorous, reproducible, and accessible across the data analysis spectrum. Please share your results and questions. Let us know what other statistical test you want us to highlight on future blogs.